Dapper: a Large-Scale Distributed Systems Tracing Infrastructure
Abstract
Modern Internet services are often implemented as complex, large-scale distributed systems. These applications are constructed from collections of software modules that may be developed by different teams, perhaps in different programming languages, and could span many thousands of machines across multiple physical facilities. Tools that aid in understanding system behavior and reasoning about performance issues are invaluable in such an environment. Here we introduce the design of Dapper, Google’s production distributed systems tracing infrastructure, and describe how our design goals of low overhead, application-level transparency, and ubiquitous deployment on a very large scale system were met. Dapper shares conceptual similarities with other tracing systems, particularly Magpie [3] and X-Trace [12], but certain design choices were made that have been key to its success in our environment, such as the use of sampling and restricting the instrumentation to a rather small number of common libraries. The main goal of this paper is to report on our experience building, deploying and using the system for over two years, since Dapper’s foremost measure of success has been its usefulness to developer and operations teams. Dapper began as a self-contained tracing tool but evolved into a monitoring platform which has enabled the creation of many different tools, some of which were not anticipated by its designers. We describe a few of the analysis tools that have been built using Dapper, share statistics about its usage within Google, present some example use cases, and discuss lessons learned so far.
Introduction
- An engineer looking only at the overall latency may know there is a problem, but may not be able to guess which service is at fault, nor why it is behaving poorly.
- There were two fundamental requirements for Dapper: ubiquitous deployment, and continuous monitoring. Three concrete design goals result from these requirements:
- Low overhead
- Application-level transparency: A tracing infrastructure that relies on active collaboration from application-level developers in order to function becomes extremely fragile, and is often broken due to instrumentation bugs or omissions, therefore violating the ubiquity requirement.
- Scalability
- True application-level transparency, possibly the most challenging design goal, was achieved by restricting Dapper’s core tracing instrumentation to a small corpus of ubiquitous threading, control flow, and RPC library code.
- Making the system scalable and reducing performance overhead was facilitated by the use of adaptive sampling: have found that a sample of just one out of thousands of requests provides sufficient information for many common uses of the tracing data.
- The value of Dapper as a platform for development of performance analysis tools, as much as a monitoring tool in itself, is one of a few unexpected outcomes.
Distributed Tracing in Dapper
- Trace trees and spans: In a Dapper trace tree, the tree nodes are basic units of work which we refer to as spans. A span is also a simple log of timestamped records which encode the span’s start and end time, any RPC timing data, and zero or more application-specific annotations. All spans associated with a specific trace also share a common trace id.
- Span start and end times as well as any RPC timing information are recorded by Dapper’s RPC library instrumentation.
- If application owners choose to augment the trace with their own annotations, these are also recorded with the rest of the span data. In order to protect Dapper users from accidental overzealous logging, individual trace spans have a configurable upper-bound on their total annotation volume. In addition to simple textual annotations, Dapper also supports a map of key-value annotations that give developers more tracing power, such as maintaining counters, logging binary messages, and transporting arbitrary user-defined data along with a traced request within a process. Currently, 70% of all Dapper spans and 90% of all Dapper traces have at least one application-specified annotation.
- A span can contain information from multiple hosts; in fact, every RPC span contains annotations from both the client and server processes, making two-host spans the most common ones.
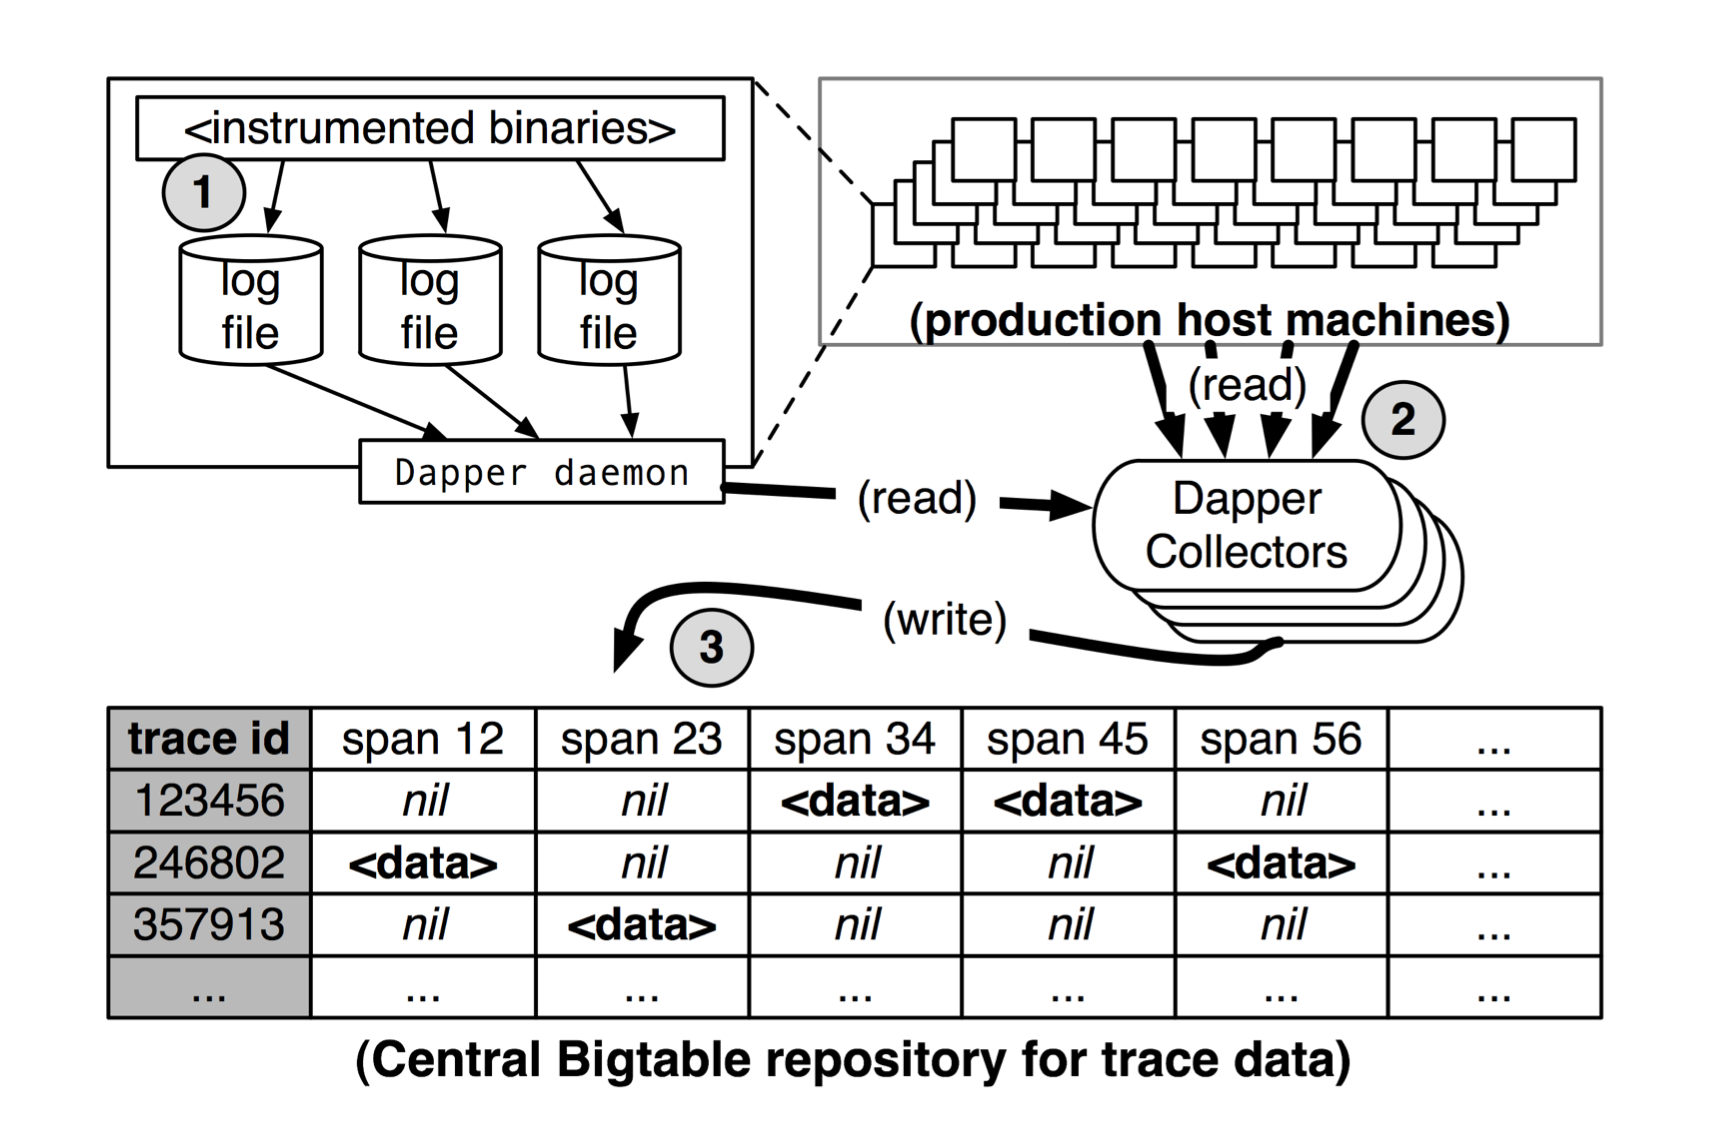
- Trace collection: First, span data is written to local log files. It is then pulled from all production hosts by Dapper daemons and collection infrastructure and finally written to a cell in one of several regional Dapper Bigtable repositories.
- The median latency for trace data collection – that is, the time it takes data to propagate from instrumented application binaries to the central repository – is less than 15 seconds. The 98th percentile latency is itself bimodal over time; approximately 75% of the time, 98th percentile collection latency is less than two minutes, but the other approximately 25% of the time it can grow to be many hours.
- Since security and privacy concerns are non-negotiable, Dapper stores the name of RPC methods but does not log any payload data at this time. Instead, application-level annotations provide a convenient opt-in mechanism.
General-Purpose Dapper Tools
- Have iteratively built up the collection infrastructure, programming interfaces, and an interactive web-based user interface to help Dapper users solve their problems independently:
- The Dapper “Depot API,” or DAPI, provides direct access to the distributed trace records in the regional Dapper repositories (or “Depots”).
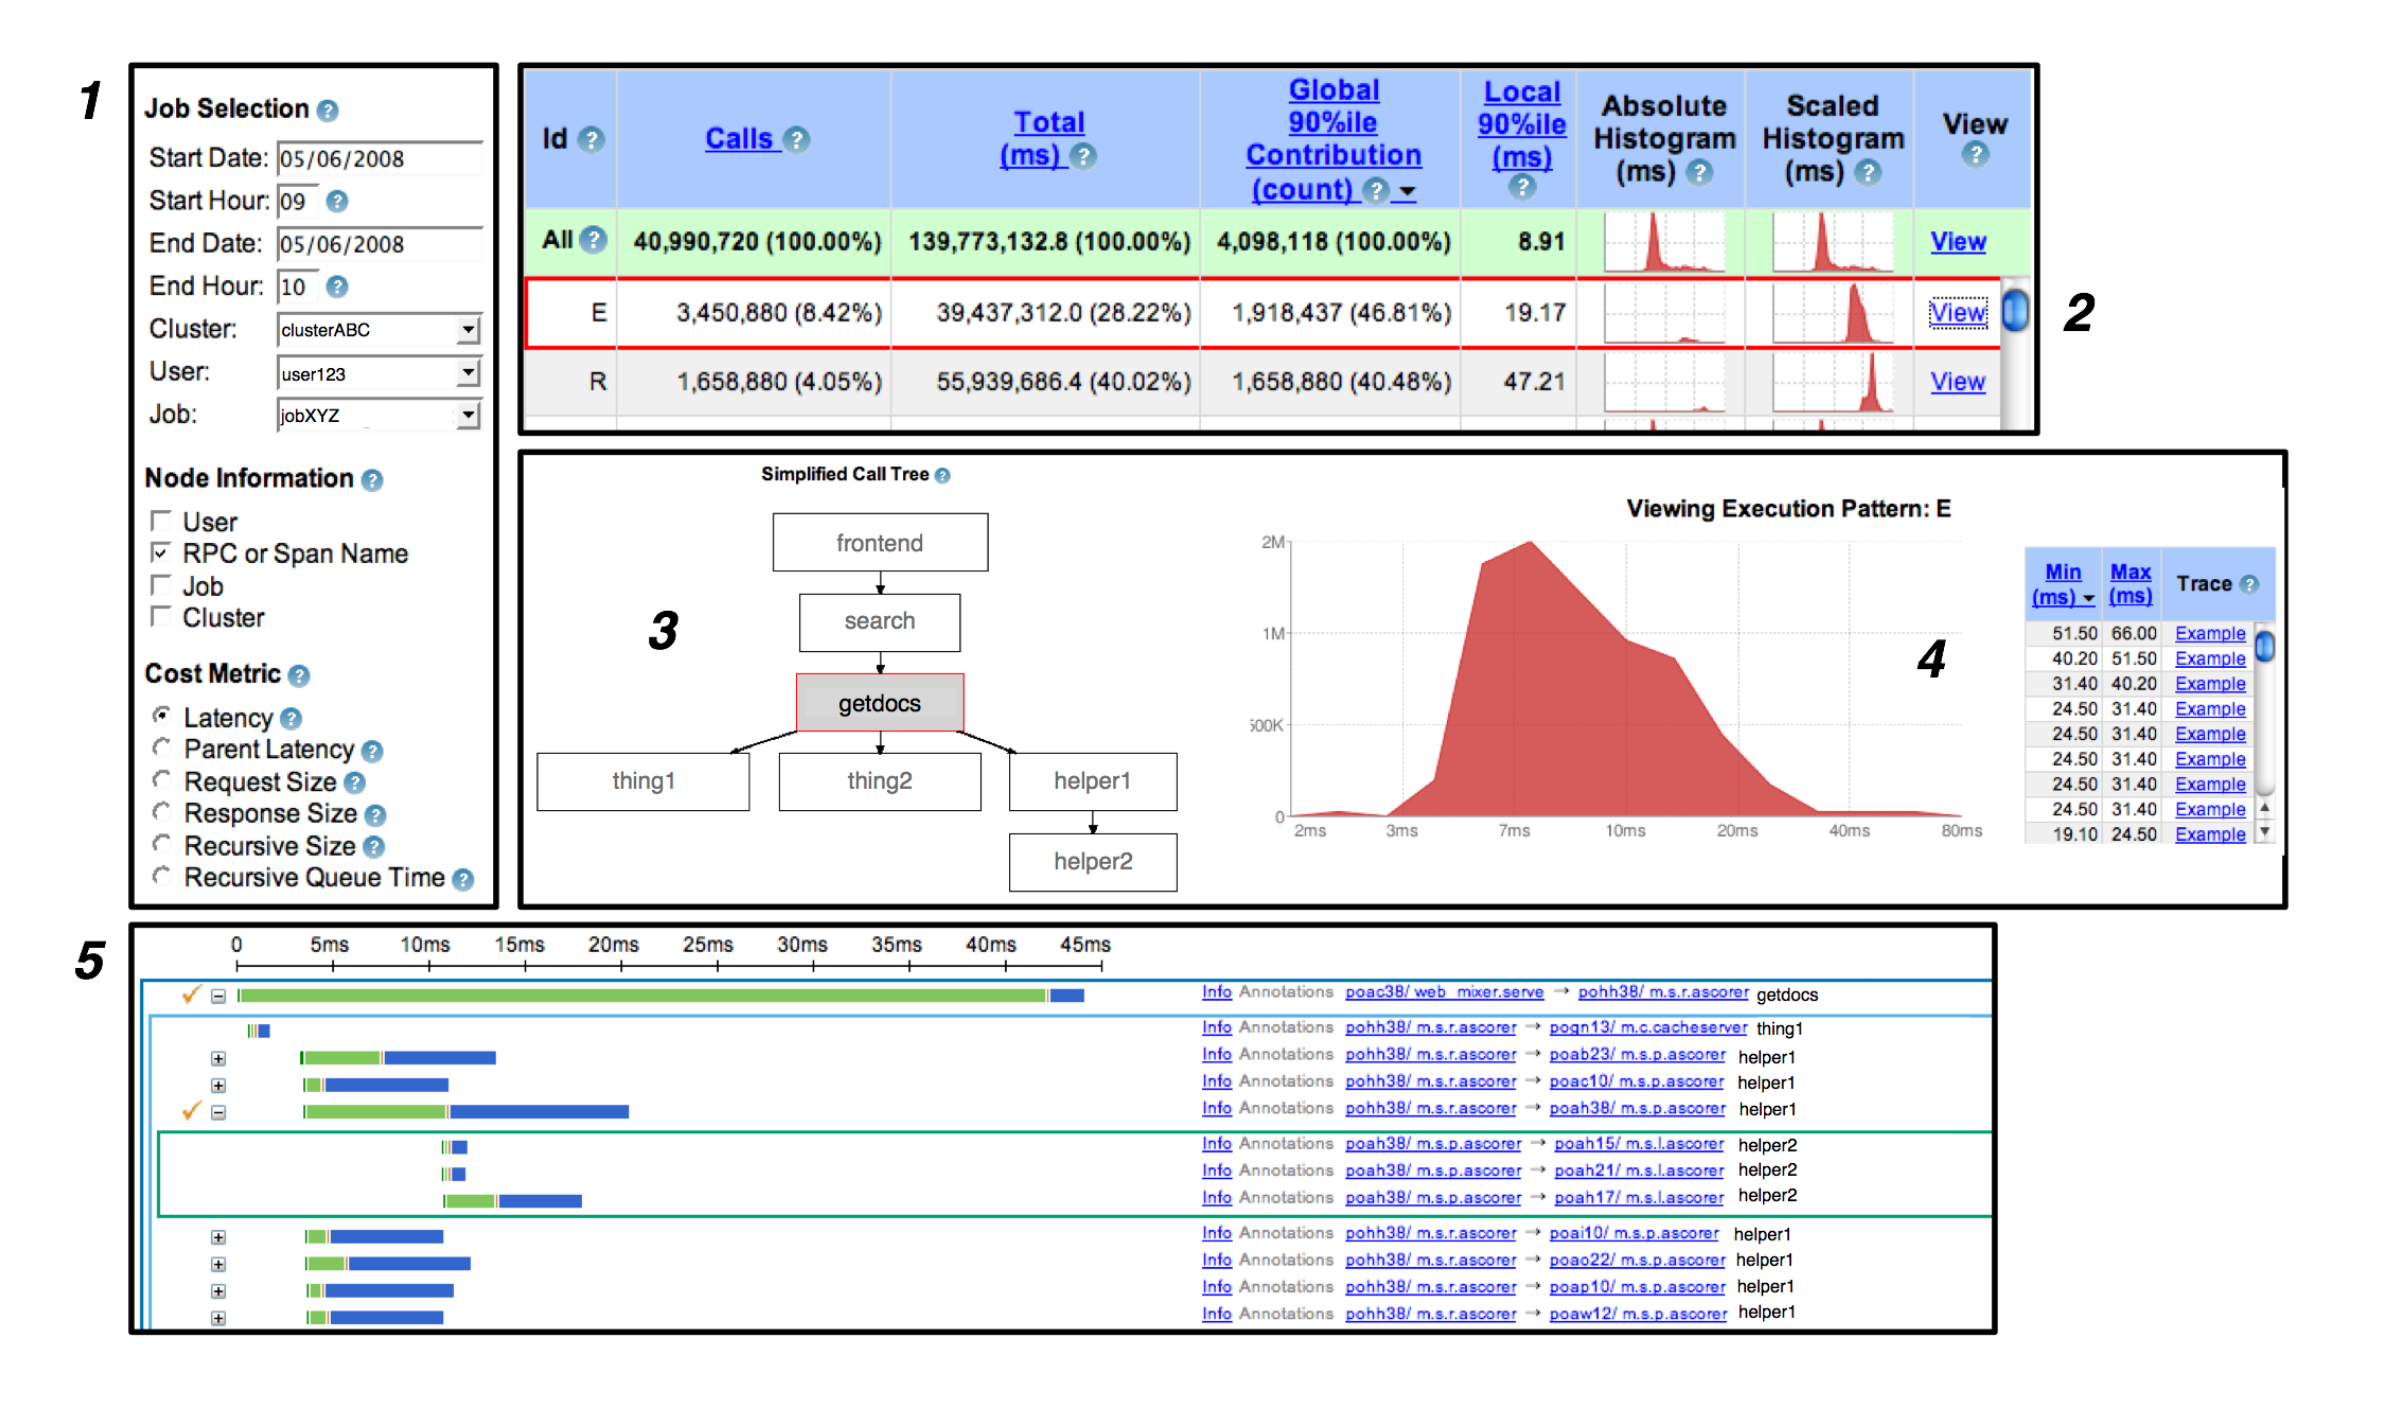
- The Dapper User Interface:
Experiences
Dapper has been found useful for the following use cases:
- During development
- Addressing long tail latency
- Inferring service dependencies
- Network usage of different services
- Layered and Shared Storage Systems
- Firefighting with Dapper
Lessons Learned
Below are some of the limitations of Dapper:
- Coalescing effects: In some cases it is more efficient to buffer a few requests before performing an operation on a group of requests at once (coalescing of disk writes is one such example). In such instances, a traced request can be blamed for a deceptively large unit of work.
- Tracing batch workloads:: For offline data intensive workloads, such as those that fit the MapReduce model, we need to associate a trace id with some other meaningful unit of work, such as a key (or range of keys) in the input data, or a MapReduce shard.
- Finding a root cause: Dapper is effective in determining which part of a system is experiencing slowdowns, but is not always sufficient for finding the root causes.
- Logging kernel-level information:: We have a number of tools capable of tracing or otherwise profiling kernel execution, but tying that information to a trace context that resides at user level is difficult to accomplish in a general and unobtrusive manner.
Over the next few Saturdays, I'll be going through some of the foundational papers in Computer Science, and publishing my notes here. This is #11 in this series.